The most basic, difficult and entertaining question that we can ask before the NFL season gets rolling is: How good is everyone going to be?

Even Vegas isn’t all that accurate when it comes to projecting win totals. A look into pre-season over/unders in 2021 by Numbers Fire found that one-fourth of the over/unders missed by 3.5 games or more and two-thirds were off by at least 1.5 games.
Interestingly, the Vegas predictions were closer to expected W-L totals based on point differential. That that tells us is that randomness and luck can swing seasons like crazy but we do have some ability to put our finger on team strength. One of the reasons for that is because offense is more stable from year to year than defense and offense drives success more than the defensive side.
That brings us to the Vikings. With so many questions on the defensive side, it’s much harder to prognosticate what Brian Flores’s group is going to do in 2022 (especially before seeing it in training camp) but the Vikings’ offense isn’t wildly different than last year. The play caller, quarterback, No. 1 receiver, tight end, No. 2 receiver and five offensive linemen are all the same.
There is some assumption that the learning curve for Kevin O’Connell as HC/play-caller and players learning his system may have held back the Vikings’ offense at times but that’s one of many factors that play into an analysis of what they are going to look like this season. Let’s try to parse out the numbers from 2022 to find areas where the Vikings could perform better/worse/same in attempts to predict where they will finish in 2023…
The fastest way to decide how good an offense was is to look at a team’s points per game production. By that metric, the Vikings finished eighth with 24.9 points per context, only a shade behind the high-powered Cincinnati Bengals. But outside of the top two or three offenses, the rest can be influenced by a bunch of factors. Defensive and special teams touchdowns, field goal efficiency, red zone performance and score effects can shape the point total.
In the Vikings’ case, they didn’t score an abnormal amount of non-offensive touchdowns or kick particularly well but score effects did impact their offensive output. When down, they were one of the best offenses in the NFL in touchdown production and mediocre when the score would not effect how the game was being played defensively i.e. in close situations through the first three quarters.
Touchdowns when trailing:
Miami — 29
Green Bay — 26
Washington — 26
Giants — 26
Minnesota — 25
Touchdowns in the first three quarters (when close)
Buffalo — 37
Philadelphia — 35
Kansas City — 30
San Francisco – 30
Minnesota 21 (tied for 12th)
You can see where playing from behind so often would impact their scoring in Kirk Cousins’s numbers. En route to eight fourth-quarter comebacks, the Vikings’ QB threw a lot of passes when losing. That doesn’t mean garbage time but it does mean putting the gas pedal down in an effort to come back.
Pass attempts when trailing:
- Tom Brady — 447
- Trevor Lawrence — 324
- Kyler Murray — 315
- Kirk Cousins — 312
If the score made a big difference in the stats, how can we get a better idea of who they really were as an offense last year?
One way is looking at them on a per-drive basis. The Vikings were much more average by that measure, ranking 24th in plays per drive (think about all the third quarter three-and-outs), 19th in yards per drive and 12th in points per drive. Analytics expert Sam Hoppen published this chart showing the Expected Points Added, which could be described as performance vs. situation:
The NFL playoffs start this weekend, so I built a portfolio of charts to exhibit each playoff team's strengths and weaknesses! 🧵
First, EPA per Drive:
The usual suspects appearing where they should, but Jacksonville also showing up strongly! pic.twitter.com/s4HghAJPLm
— Sam Hoppen (@SamHoppen) January 11, 2023
Only the Bucs had a worse EPA/drive of all the NFC playoff games, including the team they lost to in the playoffs. We can reasonably conclude that the Vikings still had a pretty good offense but it looked better in terms of points per game than it actually was.
So that means there is room for improvement, right? Yes and no.
On a per-drive basis, the Vikings have not often been elite in the Cousins era. Only once have the Vikings been well above average in the percentage of drives in which they produce points since he arrived in 2018.
Scoring percentage rank by year
2022 — 17th
2021 — 15th
2020 — 18th
2019 — 6th
2018 — 23rd
Is there something that O’Connell can do that Kevin Stefanski did in 2019 to change the trend? That year the Vikings mauled teams on play-actions and screens, neither of which worked all that effectively for them last season. The other obvious difference is the running game. In ‘19, they ran for 2,133 yards as a team on the ground, which is nearly 500 yards more than in ‘22.
How many points would it be worth to improve to an elite or even average run game? Well…
Rushing EPA of teams without running QBs (at least 300 yards rushing by QB):
Cleveland — 42.9
Carolina — 26.7
Pittsburgh — 24.7
Dallas — 22.3
Green Bay — 22.2
Minnesota — Minus-15.3
Hey, it’s Kevin Stefanski again.
While it isn’t likely the Vikings could put up Cleveland’s rushing numbers in terms of EPA, the best possible outcome to get them in the top five of teams without rushing QBs would gain them somewhere around 35-40 points. That’s an entire game’s worth. And while there have been some analytical looks at play-action that say that running doesn’t always cause successful play-action, you can’t tell me that it wouldn’t help O’Connell’s offense.
Even getting to average would mean tacking on a couple touchdown’s worth of points and at least give opposing defenses something to think about.
Another potential area of improvement is the Vikings’ offensive line. Last year defensive coordinators had a field day with interior pass rush but there is an opportunity for the young(ish) guards to take steps forward and for continuity to help them take a significant jump.
The question is how much better the O-line needs to be from their 13th overall ranking by PFF for 2022.
Here is a chart from Neil Greenberg of the Washington Post that shows how much more successful offenses are based on where they rank by PFF.
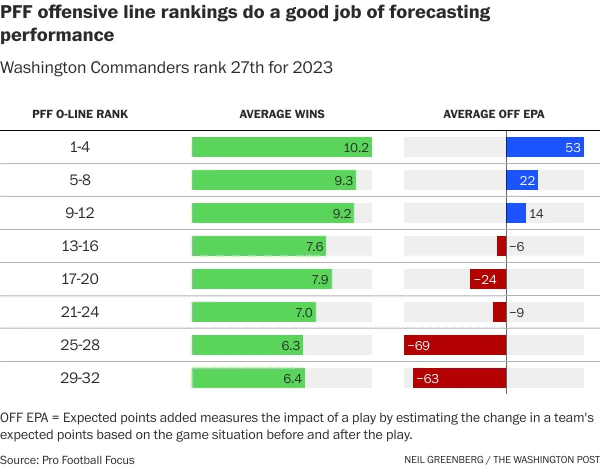
Whether the Vikings can make actual gains really depends on how much better they perform. If they go from 13th to 9th, the gap isn’t particularly wide in offensive EPA. If they get into the top eight, there seems to be a big jump in the difference it makes in scoring and the top four O-lines are significantly raising the play of the offense. With two elite tackles, it’s not impossible to put together an elite offensive line. It’s not easy to project that, however, because we do not have a sample size of the interior O-line ever shining during the Cousins era.
What about the receiving part? A full season of TJ Hockenson and Jordan Addison potentially adding more of a deep threat seems like it could amp up some of Cousins’s stats from last season, which were lower than his career averages in rating, QBR, PFF grade and yards per attempt.
One thing we already know, but shows up on a chart here from PFF’s Judah Fortgang, is that Cousins is good at throwing to open receivers. He’s also good at finding them.
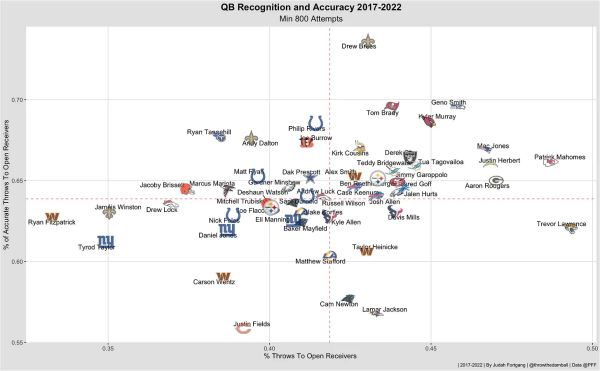
We can pretty well project that Justin Jefferson is going to be open but there is some question about whether he can match last year’s outrageous production in which he led the NFL in receiving.
No receiver who has gained 1,700 yards or more has ever done it again the following season.
Here’s the list:
Calvin Johnson: 1,492
Cooper Kupp: 812 (in 9 games)
Julio Jones: 1,409
Jerry Rice: 1,254
Antonio Brown: 1,284
Isaac Bruce: 1,338
Michael Thomas: 438 (in 7 games)
Marvin Harrison: 1,272
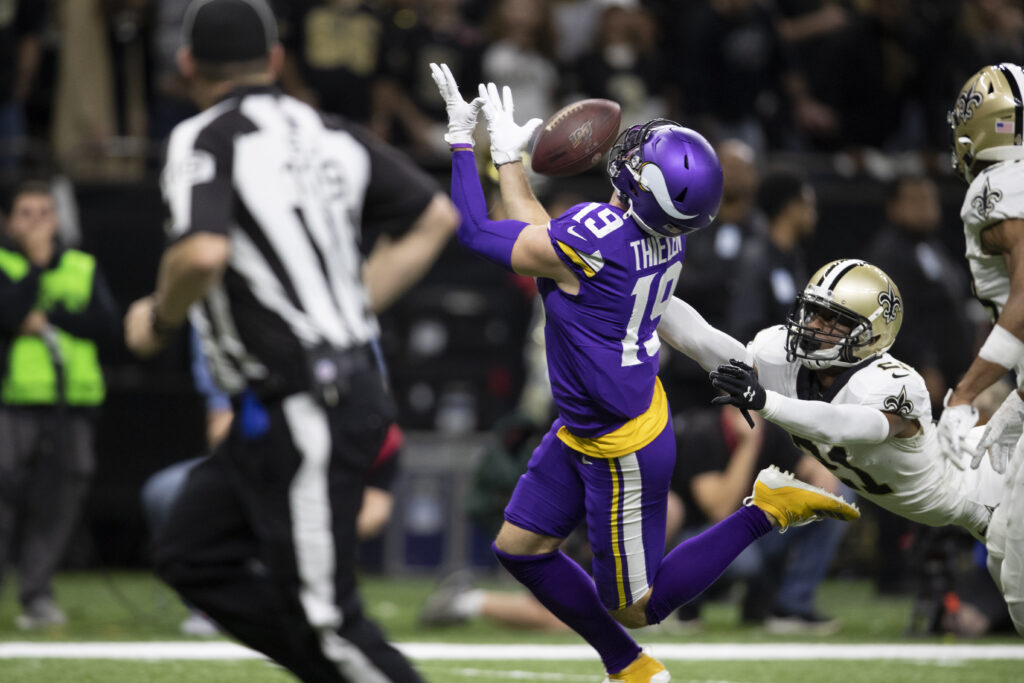
Will Addison’s presence even that out? The Vikings did target Adam Thielen regularly but his per-catch production was underwhelming.
What we find is that rookies are unpredictable, though recently there have been quite a few strong opening years. Last season there were six regularly-targeted rookie receivers who graded above 70 by PFF (above average) and four that were above 75. In 2021, there were seven. In 2020, six. If a receiver is good, the curve doesn’t seem that steep.
Thielen’s 65.0 grade might not be that difficult to top if Addison makes a quick adjustment, though he was still remarkably sure-handed with a 1.4% drop rate, second best in the NFL for players with a similar target share.
The only other factor to consider is O’Connell. How he adjusts schematically and as a play caller is very difficult to project. With all the other statistical elements pulling us in every which way, he could be the X factor that does or doesn’t take the Vikings’ offense to another level from his debut season.